
Best Productivity Metrics to Track for Effective Work
Discover the best productivity metrics to track, including goal achievement rate, output, cycle time, and quality to improve your work outcomes.
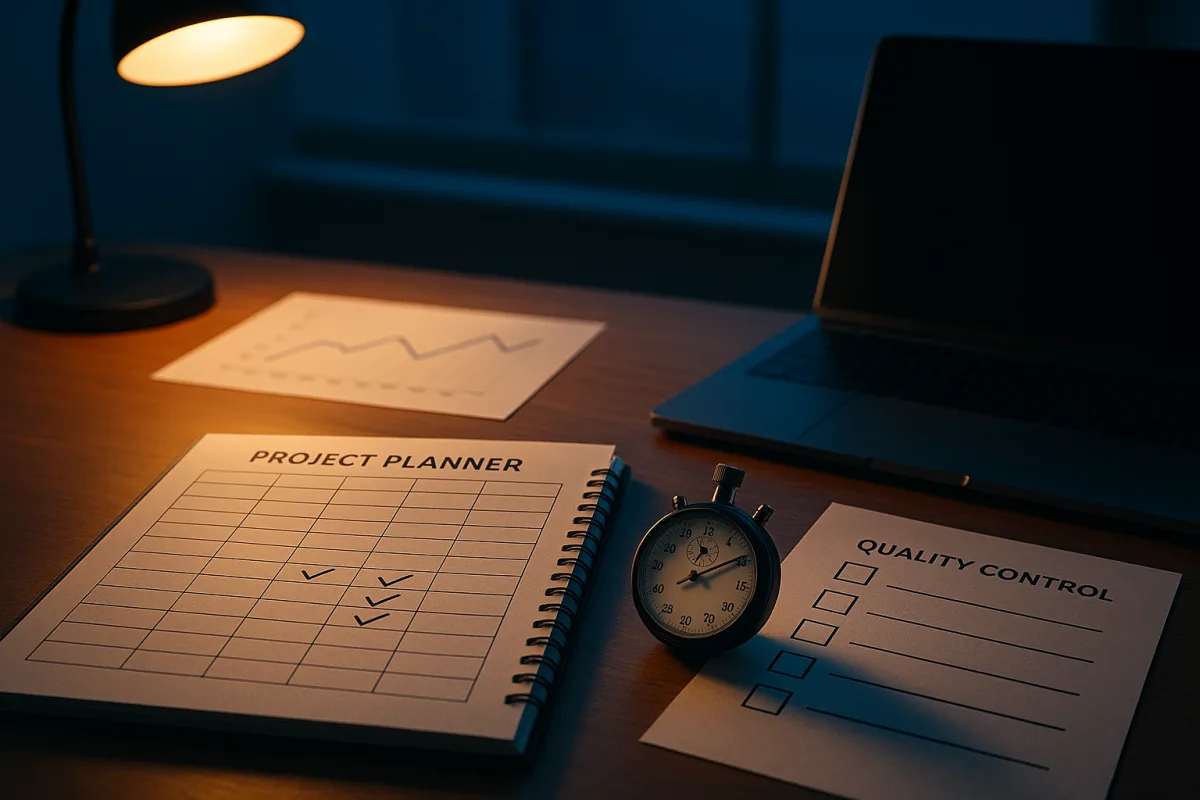
The list of commitments at the top of your week
Monday’s task list can look full by noon: reply to messages, join meetings, revise a document, update a project board, review an AI draft. At day’s end, you may have worked steadily and still not moved the work you meant to finish.
That is why we would start with goal achievement rate. It asks whether you completed the outcomes you committed to, not whether your calendar looked occupied or your timer kept running. Workday includes it among the employee performance metrics to prioritize in 2026. [3]
For an individual, a goal should describe a finished result you can recognize without argument. “Send the client a revised proposal” is a goal. “Work on proposal” is activity, and activity is where productivity tracking usually gets vague.
This metric gives you a simple weekly record: the number of planned outcomes reached, compared with the number you set out to reach. It makes overcommitting visible. It also stops a long day from automatically counting as an effective day.
The important word is “goal.” A list of 25 small tasks can produce an impressive completion rate while leaving the one consequential assignment untouched. Goal achievement rate asks you to identify that consequential assignment before the week fills up.
Workday’s recommendation is not a universal standard, and no single benchmark says what every knowledge worker should achieve. Your workload, authority, interruptions, and type of work all change the number. [3]
Still, task-completion ranges can give you a prompt to inspect your plan. TrueCalculators.net labels 90 to 100 percent completion strong, 75 to 89 percent good, 50 to 74 percent moderate and potentially overcommitted, and below 50 percent a sign of systemic problems. [8]
We would not use those bands to grade yourself. A week containing an urgent incident, a major dependency, or a poorly defined project can lower completion without saying much about your effort. Use the result to ask what changed in the work.
Build a small effectiveness scorecard around it
Goal achievement rate works best as the center of a four-part scorecard. The other numbers are there to diagnose a disappointing week, so you can change the conditions or the plan instead of trying to manufacture a higher score.
DeskTrust identifies output per active hour, focus block count, and first-pass quality rate among key productivity KPIs. FlowUpBoard highlights cycle time, the elapsed time required for work to move from starting to finished. [4][5]
Together, these measures answer four different questions. Did the intended outcome happen? How much finished work came from working time? How long did work stay open? Did it survive the first review?
Output per active hour is the first supporting number. In analytical work, it can mean completed cases, analyzed records, resolved requests, or finished pages per hour of genuinely active work. It helps separate a large assignment from a slow, fragmented workday. [4]
It breaks when the units are unequal. One customer case may take five minutes and another may involve a novel issue, several people, and sensitive consequences. Counting both as one output turns the metric into an incentive to select easy work.
Cycle time looks at the calendar span from beginning an item to completing it. A project that remains half-done for three weeks has a different cost from one completed in two focused sessions, even if both required the same total hours. [5]
Cycle time exposes handoffs, unclear requirements, approval queues, and work that repeatedly returns for revision. It also catches a familiar personal-system problem: opening too many items at once, then losing track of where each one stands.
It can be unfair when the delay belongs to someone else. A proposal awaiting a client decision is not evidence that you worked slowly. Keep a note beside unusual items so an external wait does not get mistaken for a performance trend.
First-pass quality rate supplies the check that output and speed lack. It asks how often work reaches the required standard without substantial correction, rework, or return. DeskTrust lists it among the core measures alongside output and focus blocks. [4]
A higher output count with falling first-pass quality is a warning, not a win. The person reviewing, correcting, and reconciling rushed work spends time too. Your system should count that downstream cost, even if it lands on someone else’s desk.
A minimal weekly review can therefore fit on one page: goals completed, output per active hour where your work has comparable units, cycle time for a few recurring work types, and first-pass quality. Record exceptions beside the numbers.
This is the balanced approach we would keep. It makes outcome the headline, while speed and quality stop you from improving one number by quietly damaging another. It also takes less daily maintenance than a dashboard with dozens of charts.
Focus blocks are a clue, not a quota
Focus block count is the fourth supporting measure, not a score of personal virtue. It records periods in which you worked continuously on a defined task, and can reveal whether interruptions are preventing work from reaching completion. [4]
There is no accepted target length for a focus session. Hubstaff reports two to three hours of deep focus daily, about 39 percent of tracked time, while ActivTrak data reported by Business Operations Pro puts the average session at 13 minutes and 7 seconds. [6][7]
Those figures are too far apart to turn into a rule like “you need three hours” or “13 minutes is normal.” They reflect different measurement methods and definitions, as well as different kinds of work. [6][7]
Use focus blocks to investigate your own pattern. If goal achievement falls while your work fragments into short stretches, interruptions may be part of the explanation. If you complete goals with short sessions, forcing longer ones adds a requirement without a demonstrated benefit.
Do not treat a timer as a medical assessment of concentration, fatigue, mood, or sleep. If those concerns are affecting your life or work, they belong with a doctor, not a productivity dashboard.
Creative work needs a different scorecard
Output per active hour can work well where a finished unit is clear and comparable. It becomes strained for a designer developing a concept, a writer finding an argument, or a strategist investigating a problem with no known answer.
Deloitte argues that productivity measurement in creative fields needs rethinking, with greater attention to human performance and outcomes than traditional quantitative measures. [11] The work can be real before it produces a countable unit.
For creative roles, keep goal achievement rate, cycle time, and a qualitative definition of quality. A completed goal might be an approved direction, a draft that meets its brief, or a decision-ready recommendation, with criteria agreed before the work begins.
The review may require another person: an editor, manager, client, or collaborator who can assess whether the result answered the brief. That makes measurement slower and less tidy, but the alternative is rewarding volume that says little about value.
We would skip targets such as words per hour or ideas per day unless the job already has comparable, repeatable units. They can help estimate capacity in a narrow workflow. They are poor stand-ins for judgment or originality.
AI output has to clear the quality check
AI makes activity numbers especially easy to misread. Half of U.S. employees used AI at work in early 2026, and 65 percent of workers at AI-adopting companies said they felt positive about its productivity impact. [10]
Positive sentiment can be real while the result still needs checking. Reports on “workslop” describe AI-generated material that looks finished but creates extra work for the people who must correct, verify, or rewrite it. [22]
Do not track prompts, tokens, or AI sessions as productivity. Those measures describe consumption and activity. They do not tell you whether a customer got a better answer, a decision arrived sooner, or a colleague spent less time repairing the output.
Instead, compare a recurring piece of work before and after AI enters the process. Did cycle time decrease? Did first-pass quality remain steady or improve? Did the completed goal still meet the original standard? Those are the measures that can show a gain.
If AI produces a faster draft but lowers first-pass quality, the time saving may be fictional. The correction burden has merely moved later in the workflow, often to the person with responsibility for accuracy.
Choose a tracker that serves the scorecard
You do not need specialized software to track four weekly numbers. A notes app or spreadsheet can hold a short list of commitments, completed outcomes, start and finish dates, and reasons for delays or rework.
If automatic or detailed tracking would reduce your administrative work, the available tools differ mainly in what they ask you to record. Toggl Track’s Starter plan costs $9 per user monthly and includes timers and reporting. [12][15]
RescueTime’s Focus plan costs $7 a month and combines automatic tracking with distraction blocking. It suits someone who wants a record of time without starting and stopping a timer for every task. [14]
Clockify has a free basic plan, with paid plans beginning at $3.75 per user per month. It fits straightforward time logging, especially if you need to categorize time across clients, projects, or recurring work. [13][15]
Todoist Premium costs about $4 monthly and includes task management with its Karma system. Habitify Premium costs $6.99 monthly and focuses on habit tracking and integrations. [16][17][18]
We would start with the least intrusive option. A timer is worthwhile when you need output-per-hour or cycle-time evidence for repeated work. Habit tracking can help you remember a routine, but it cannot tell you whether the week’s important outcomes happened.
Review the scorecard once a week, then make one change. Reduce the number of goals, define one vague goal properly, protect a recurring work block, or add a quality check before sending work onward. A metric earns its place only when it changes what you do next.
Frequently Asked Questions
What are the best productivity metrics to track for knowledge workers?
The top productivity metrics include goal achievement rate, output per active hour, cycle time, focus block count, and first-pass quality rate. These metrics together provide a balanced view of whether intended outcomes are met, how much work is completed during active time, how long tasks take to finish, and the quality of work on first review.
How do I measure goal achievement rate effectively?
Goal achievement rate measures the number of planned outcomes completed compared to those set at the start of a period. It focuses on finished results rather than activity, helping to reveal overcommitment and whether consequential tasks were completed. Tracking this weekly can prompt adjustments to plans when completion rates fall below expected ranges.
Which productivity metrics help diagnose work performance issues?
Output per active hour, cycle time, and first-pass quality rate serve as diagnostic metrics alongside goal achievement rate. They help identify if work is progressing efficiently, how long tasks remain open, and whether work passes initial quality checks, enabling adjustments to improve performance rather than just increasing activity.
How can I balance speed, quality, and output in productivity tracking?
Balancing these elements requires using multiple metrics: cycle time tracks speed, first-pass quality rate measures quality, and output per active hour gauges quantity of work completed. Together, they provide a fuller picture than any single metric, allowing you to understand trade-offs and make informed decisions about where to focus improvement efforts.
Why should focus time be treated as a diagnostic metric?
Focus time varies widely in length and effectiveness across studies, with estimates ranging from brief 13-minute sessions to several hours of deep focus daily. Because of this variability and differing definitions, focus time should not be a target but rather a diagnostic tool to understand work patterns and identify potential barriers to sustained concentration.
How we researched this
This article was assembled from 24 cited references.
Nothing here is based on hands-on testing. Where a figure or finding appears, it belongs to the source cited beside it, and the writing says so rather than implying otherwise. Every source is listed below so you can check it.
Sources
- Productivity and Costs by Industry: Wholesale Trade and Retail Trade Industries - 2025 - 2025 A01 Results
- Strong Q3 labor output shows a productivity surge
- Top Employee Performance Metrics to Prioritize in 2026 | Workday US
- 15 Employee Productivity KPIs to Track in 2026 | DeskTrust
- Productivity Metrics 2026: The Complete Guide to Measuring What Actually Ships | FlowUpBoard
- 2026 Global Work Trends & Benchmarks Report: How Work Gets Done
- Collaboration Time Is Up 34%, but the Average Focus Session Lasts 13 Minutes | Business Operations Pro
- Task Completion Rate Calculator - Measure Your Productivity
- Productivity patterns across industries: OECD Compendium of Productivity Indicators 2026 | OECD
- Half of all US employees now use artificial intelligence at work, crossing landmark threshold for first time - Gallup data shows daily and weekly usage hitting all-time high of 28% in Q1 2026, with 65% feeling positive about its impact on productivity
- Why measuring productivity fails | Deloitte Insights
- Logos, Product Images and Press Releases | Toggl Track
- Best Time Management Apps in 2026: Top Picks Compared
- RescueTime Review: Automatic Time Tracking & Productivity Analytics
- The 5 best time tracking apps in 2026 | Zapier
- Top 8+ Apps for Habit Tracking: Becoming a More Productive You
- Ditch the February resolution slump with this habit-tracking powerhouse
- The 10 Best Apps to Measure Your Productivity in 2026
- Common Mistakes in Performance Metrics Used by Top Companies - Business G Expert
- Metrics and Measurement: Importance in Performance
- 16 Productivity Metrics Every Manager Needs
- AI was supposed to boost productivity - but a new report says 'workslop' is making it worse
- How to Measure Focus Time and Why It Matters | SettlTM
- Working Remotely? Selection, Treatment, and the Market for Remote Work
Related Articles
How to Measure Productivity Effectively
Learn how to measure productivity effectively using progress, quality, and time tracking for meaningful insights into your work.
Manage Remote Team Productivity
Learn how to manage remote team productivity with meeting limits, outcome-based KPIs, and clear communication strategies for better results.
How to Create a Personal Productivity Dashboard That Works
Learn how to create a personal productivity dashboard with key metrics, project tracking, and review tips to boost your focus and progress.
How to Create a Vision Board for Goals That Work
Learn how to create a vision board for goals with clear actions, focused images, and tips to boost productivity and follow-through.